Multiple Choice
Solve the problem.
-The following bar graph shows the average annual income for single mothers. 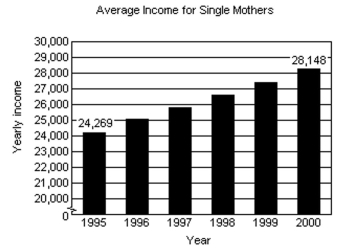 i) Determine a linear function that can be used to estimate the average yearly income for single mothers from 1995 through 2000. Let t represent the number of years from 1995. (In other words, 1995 corresponds to t = 0, 1996
Corresponds to t = 1, and so on.)
Ii) Using the function from part i, determine the average yearly income for single mothers in 1996.
Iii) Assuming this trend continues, determine the average yearly income for single mothers in 2010.
Iv) Assuming this trend continues, in which year will the average yearly income for single mothers reach $31,000?
A) 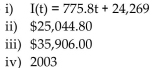
B) 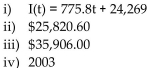
C) 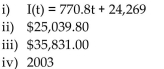
D) 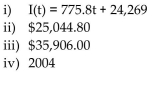
Correct Answer:

Verified
Correct Answer:
Verified
Q47: Solve the problem.<br>-The formula for changing Celsius
Q48: Find the requested value.<br>-<img src="https://d2lvgg3v3hfg70.cloudfront.net/TB8475/.jpg" alt="Find the
Q49: Solve the problem.<br>-The formula for the circumference
Q50: Graph the equation.<br>-<img src="https://d2lvgg3v3hfg70.cloudfront.net/TB8475/.jpg" alt="Graph the equation.
Q51: Use a calculator to obtain at least
Q53: Two points on L1 and two points
Q54: Solve the problem.<br>-A vendor has learned that,
Q55: Determine whether the two given lines are
Q56: Determine whether the graph illustrated represents a
Q57: List the set in roster form.<br>-S =