Multiple Choice
Use the REGRESSION feature on a graphing calculator.
-The use of bottled water in the United States has shown a steady increase in recent years. The table shows the annual per capita consumption for the years 1995 - 2001. 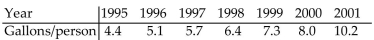 With x being the years since 1995, find the linear function that represents this data. Round your answer to two decimal
Places.
A) y = 4.07x + 0.89
B) 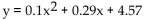
C) 
D) y = 0.89x + 4.07
Correct Answer:

Verified
Correct Answer:
Verified
Q16: Solve the problem.<br>-The population P, in thousands,
Q17: Use a calculator to evaluate the expression.
Q18: Find the equations of any vertical asymptotes.<br>-<img
Q19: Find the function value.<br>-Find f(-6) when <img
Q20: Solve the equation.<br>-Solve for <img src="https://d2lvgg3v3hfg70.cloudfront.net/TB8593/.jpg" alt="Solve
Q22: Use point-by-point plotting to sketch the graph
Q23: Graph the function.<br>-<img src="https://d2lvgg3v3hfg70.cloudfront.net/TB8593/.jpg" alt="Graph the function.
Q24: Provide an appropriate response.<br>-For f(t) = 3
Q25: Solve the equation graphically to four decimal
Q26: Determine the domain of the function.<br>-f(x) =