Multiple Choice
Use the REGRESSION feature on a graphing calculator.
-For some reason the quality of production decreased as the year progressed at a flash drive manufacturing plant. The following data represent the percentage of defective flash drives produced at the plant in the
Corresponding month of the year. 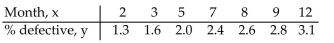 Use the regression equation with values rounded to four decimals to predict the percentage of defective drives in month
6, June.
A) 2.3%
B) 2.0%
C) 2.20%
D) 2.15%
Correct Answer:

Verified
Correct Answer:
Verified
Q49: Solve the problem.<br>-Suppose the cost per ton,
Q50: Graph the linear equation and determine its
Q51: Use interval notation to write the solution
Q52: Find the slope and y intercept of
Q53: Solve the equation graphically to four decimal
Q55: Use the properties of logarithms to solve.<br>-<img
Q56: Provide an appropriate response.<br>-What is the minimum
Q57: For the rational function below (i) Find
Q58: Provide an appropriate response.<br>-<img src="https://d2lvgg3v3hfg70.cloudfront.net/TB8593/.jpg" alt="Provide an
Q59: Graph the function using a calculator and