Multiple Choice
The percentage of an adult population that smokes can be modeled by the function P(x) whose graph
Is shown below. The input x is years after 1955. In what year did the percentage of smokers drop below
20%? 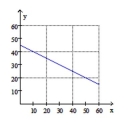
A) 2015
B) 1995
C) 1985
D) 2005
Correct Answer:

Verified
Correct Answer:
Verified
Q67: Graph <img src="https://d2lvgg3v3hfg70.cloudfront.net/TB8446/.jpg" alt="Graph " class="answers-bank-image
Q68: Write the ratio as a fraction and
Q69: Graph the linear function. <img src="https://d2lvgg3v3hfg70.cloudfront.net/TB8446/.jpg" alt="Graph
Q70: Graph y = -1.
Q71: A puppy gets <img src="https://d2lvgg3v3hfg70.cloudfront.net/TB8446/.jpg" alt="A puppy
Q73: A waitress made $6.53 per hour plus
Q74: Graph <img src="https://d2lvgg3v3hfg70.cloudfront.net/TB8446/.jpg" alt="Graph ."
Q75: Graph the parabola <img src="https://d2lvgg3v3hfg70.cloudfront.net/TB8446/.jpg" alt="Graph the
Q76: If the perimeter of a triangular flower
Q77: Graph the linear function <img src="https://d2lvgg3v3hfg70.cloudfront.net/TB8446/.jpg" alt="Graph