Multiple Choice
The percentage of an adult population that smokes can be modeled by the function P(x) whose graph
Is shown below. The input x is years after 1955. In what years was the percentage of nonsmokers less than
60? 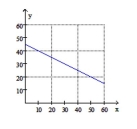
A) 0 - 60
B) 1955 - 2015
C) 1955-1970
D) 1955 - 1965
Correct Answer:

Verified
Correct Answer:
Verified
Q40: Graph <img src="https://d2lvgg3v3hfg70.cloudfront.net/TB8446/.jpg" alt="Graph " class="answers-bank-image
Q41: Graph the parabola <img src="https://d2lvgg3v3hfg70.cloudfront.net/TB8446/.jpg" alt="Graph the
Q42: A community college has 3,000 students and
Q43: The homecoming committee is blowing up balloons
Q44: Write the equation in the slope-intercept form.
Q46: A newspaper advertisement costs $5.00 per week
Q47: Find the domain and range of the
Q48: Find the slope. <img src="https://d2lvgg3v3hfg70.cloudfront.net/TB8446/.jpg" alt="Find the
Q49: At a certain restaurant, one out of
Q50: Graph <img src="https://d2lvgg3v3hfg70.cloudfront.net/TB8446/.jpg" alt="Graph " class="answers-bank-image