Essay
Fifty people participated in a poll to determine their favorite ice cream flavor. Use the data to
construct a bar graph. 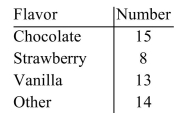
Correct Answer:

Verified
Correct Answer:
Verified
Related Questions
Q84: A researcher numbered all of the colleges
Q85: To study the number of credit hours
Q86: Find the variance. <img src="https://d2lvgg3v3hfg70.cloudfront.net/TB8446/.jpg" alt="Find the
Q87: A researcher randomly selected three states and
Q88: These data represent the number of trees
Q90: For the 20 test scores shown, find
Q91: Find the equation of the regression line
Q92: For the 20 test scores shown, find
Q93: If a student's rank in a class
Q94: Find the equation of the regression line