Essay
A small company did a poll of how their employees commuted to work. Use the data to draw a bar
graph. 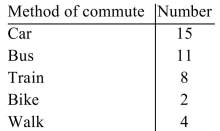
Correct Answer:

Verified
Correct Answer:
Verified
Related Questions
Q155: A professor has two sections of Math
Q156: Evaluate this claim by an advertiser: 64%
Q157: The frequency distribution below was obtained by
Q158: Find the area under the normal distribution
Q159: Suppose the mean number of candies in
Q161: Use the equation of the regression line
Q162: Provided below are the sizes of 15
Q163: Find the area under the normal distribution
Q164: Construct a pie chart for the number
Q165: A researcher is studying possible grade inflation