Essay
The following frequency distribution shows for a certain high school the number of freshmen,
sophomores, juniors, and seniors who smoke. Construct a pie chart for the data. 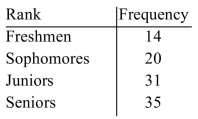
Correct Answer:

Verified
Correct Answer:
Verified
Q139: The table shows the number of class
Q140: Find the value for the correlation coefficient
Q141: Find the standard deviation. <img src="https://d2lvgg3v3hfg70.cloudfront.net/TB8446/.jpg" alt="Find
Q142: The is the mean of the smallest
Q143: According to recent research, the mean height
Q145: When an existing group of subjects that
Q146: Find <img src="https://d2lvgg3v3hfg70.cloudfront.net/TB8446/.jpg" alt="Find for
Q147: Find the mean. <img src="https://d2lvgg3v3hfg70.cloudfront.net/TB8446/.jpg" alt="Find the
Q148: The table below lists the average high
Q149: A university finished the season ranked fourth