Essay
These data represent the number of stray dogs in a certain city for the years listed. Draw a time
series graph for the data. 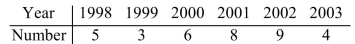
Correct Answer:

Verified
Correct Answer:
Verified
Related Questions
Q164: Construct a pie chart for the number
Q165: A researcher is studying possible grade inflation
Q166: Find the mode. <img src="https://d2lvgg3v3hfg70.cloudfront.net/TB8446/.jpg" alt="Find the
Q167: Construct a pie chart for the following
Q168: Find the value for the correlation coefficient
Q170: For the 8 test scores shown, find
Q171: Alice scored in the 45th percentile rank
Q172: A small company did a poll of
Q173: A researcher grouped the schools by two-year
Q174: The exam grades of 31 students were