Essay
These data represent the number of students enrolled at a community college. Draw a time series
graph for the data. 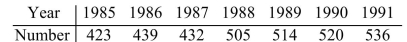
Correct Answer:

Verified
Correct Answer:
Verified
Related Questions
Q148: The table below lists the average high
Q149: A university finished the season ranked fourth
Q150: The average selling price of homes in
Q151: When data are normally distributed, approximately of
Q152: Fifty families reported their annual household income
Q154: The exam grades of 31 students were
Q155: A professor has two sections of Math
Q156: Evaluate this claim by an advertiser: 64%
Q157: The frequency distribution below was obtained by
Q158: Find the area under the normal distribution