menu-iconExamlexExamLexServices

Discover

Ask a Question
  1. All Topics
  2. Topic
    Mathematics
  3. Study Set
    Math in Our World Study Set 1
  4. Exam
    Exam 11: Statistics
  5. Question
    Draw a Scatter Plot for the Data Shown
Solved

Draw a Scatter Plot for the Data Shown

Question 35

Question 35

Essay

Draw a scatter plot for the data shown. Draw a scatter plot for the data shown.

Correct Answer:

verifed

Verified

Unlock this answer now
Get Access to more Verified Answers free of charge

Related Questions

Q30: Find the area under the normal distribution

Q31: The is the value that occurs most

Q32: Provided below are the sizes of 15

Q33: The average amount customers at a certain

Q34: Given the following information about test scores,

Q36: Howard scored in the 55th percentile rank

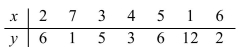
Q37: Find <img src="https://d2lvgg3v3hfg70.cloudfront.net/TB8446/.jpg" alt="Find 3

Q38: A population consists of .

Q39: An upcoming school levy in my town

Q40: The frequency distribution below was obtained by

Examlex

ExamLex

About UsContact UsPerks CenterHomeschoolingTest Prep

Work With Us

Campus RepresentativeInfluencers

Links

FaqPricingChrome Extension

Download The App

Get App StoreGet Google Play

Policies

Privacy PolicyTerms of ServiceHonor CodeCommunity Guidelines

Scan To Download

qr-code

Copyright © (2025) ExamLex LLC.

Privacy PolicyTerms Of ServiceHonor CodeCommunity Guidelines