Essay
Draw a scatter plot and describe the relationship. 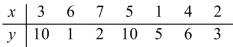
Correct Answer:

Verified
No relatio...View Answer
Unlock this answer now
Get Access to more Verified Answers free of charge
Correct Answer:
Verified
No relatio...
View Answer
Unlock this answer now
Get Access to more Verified Answers free of charge
Related Questions
Q131: A sample is taken by numbering each
Q132: A stats instructor has recorded the scores
Q133: Find the mode. <img src="https://d2lvgg3v3hfg70.cloudfront.net/TB8446/.jpg" alt="Find the
Q134: Forty new automobiles were tested for fuel
Q135: Consider the survey question "Are you in
Q137: Match each value of r with the
Q138: Use the equation of the regression line
Q139: The table shows the number of class
Q140: Find the value for the correlation coefficient
Q141: Find the standard deviation. <img src="https://d2lvgg3v3hfg70.cloudfront.net/TB8446/.jpg" alt="Find