Multiple Choice
Use a scatter plot to determine the relationship between the x values and the y values. 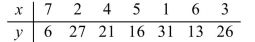
A) Nonlinear relationship
B) No relationship
C) Positive linear relationship
D) Negative linear relationship
Correct Answer:

Verified
Correct Answer:
Verified
Related Questions
Q3: The mean, also known as the arithmetic
Q4: Based on data compiled by the World
Q5: For the 8 test scores shown, which
Q6: Find the mean, median, mode, and midrange
Q7: The GPAs of 20 students are given
Q9: Suppose that you collect a very large
Q10: Find the range. <img src="https://d2lvgg3v3hfg70.cloudfront.net/TB8446/.jpg" alt="Find the
Q11: Find the value for r and test
Q12: Find the mode. <img src="https://d2lvgg3v3hfg70.cloudfront.net/TB8446/.jpg" alt="Find the
Q13: If a data value has a Z