Essay
Suppose this diagram illustrates the number of women and Democrats in the U.S. Senate. 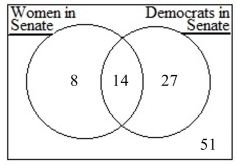 The probability that a senator is either female of Democrat can be calculated as
 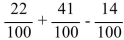 . Describe what the three fractions at the end of this calculation represent in terms
of probability.
Correct Answer:

Verified
In order they are: the probabi...View Answer
Unlock this answer now
Get Access to more Verified Answers free of charge
Correct Answer:
Verified
View Answer
Unlock this answer now
Get Access to more Verified Answers free of charge
Q2: A coin is tossed and then a
Q3: In any experiment, the set of all
Q4: Four balls are numbered 1 through 4
Q5: In a shop there are 25 customers,
Q6: Two dice are rolled. Find the probability
Q8: Draw a tree diagram to determine the
Q9: A single card is drawn from an
Q10: If two people are selected at random,
Q11: A single card is drawn from an
Q12: Two dice are rolled. Find the probability