Multiple Choice
Solve the problem.
-An accountant tabulated a firm's profits for four recent years in the following table:  The accountant then fit both a linear graph and an exponential curve (seen below) to the data, in order to estimate future profits. Use the exponential graph to estimate the profits in the year 2001.
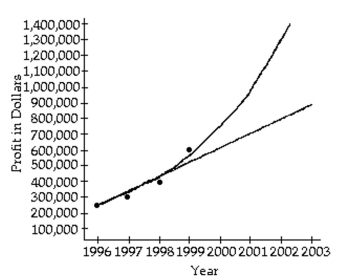
A) About $300,000
B) About $750,000
C) About $1,300,000
D) About $1,000,000
Correct Answer:

Verified
Correct Answer:
Verified
Q31: Determine whether the function is one-to-one.<br>-<img src="https://d2lvgg3v3hfg70.cloudfront.net/TB8306/.jpg"
Q32: Determine whether the given function is one-to-one.
Q33: Find the requested composition of functions.<br>-Given <img
Q34: Graph.<br>-<img src="https://d2lvgg3v3hfg70.cloudfront.net/TB8306/.jpg" alt="Graph. - A)
Q35: Find an equation of the inverse of
Q37: Graph the equation of the relation using
Q38: Determine whether the given function is one-to-one.
Q39: Solve the problem.<br>-The number of bacteria growing
Q40: Determine whether the function is one-to-one.<br>-<img src="https://d2lvgg3v3hfg70.cloudfront.net/TB8306/.jpg"
Q41: Determine whether the function is one-to-one.<br>-<img src="https://d2lvgg3v3hfg70.cloudfront.net/TB8306/.jpg"