Essay
Use a graphing utility to (a) plot the graphs of the given functions, (b) find the approximate x-coordinates of the points of intersection of the graphs, and (c) find an approximation of the volume of the solid obtained by revolving the region bounded by the graphs of the functions about the  RoundAnswers to two decimal places.
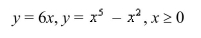
Correct Answer:

Verified
Correct Answer:
Verified
Q7: The region bounded by the given curves
Q8: Sketch the region enclosed by the curves
Q9: Find the number(s) <img src="https://d2lvgg3v3hfg70.cloudfront.net/TB8680/.jpg" alt="Find the
Q10: Find the volume of the solid generated
Q11: Graph the region between the curves and
Q13: Use the method of cylindrical shells to
Q14: Select the correct Answer for each question.<br>-Use
Q15: Select the correct Answer for each question.<br>-Sketch
Q16: The tank shown is full of water.Given
Q17: Select the correct Answer for each question.<br>-Find