Multiple Choice
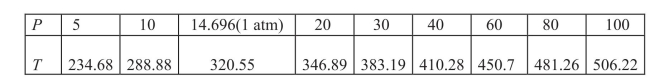
Suppose the table below shows the temperature  at which a given liquid boils at selected pressures p (pounds per square inch) .A model that approximates the data is
 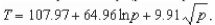 Use a graphing utility to graph
A) 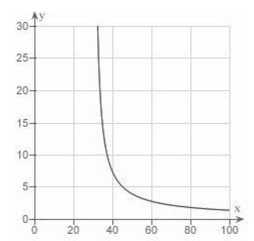
B) 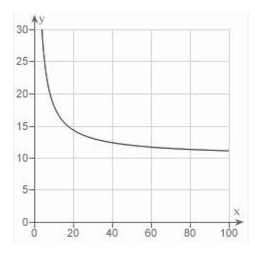
C) 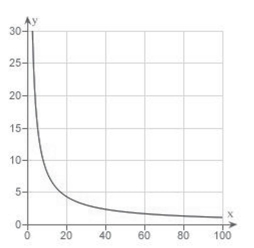
D) 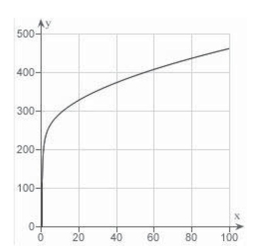
E) 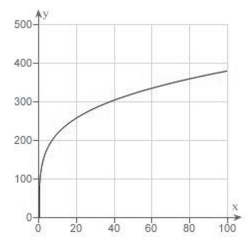
Correct Answer:

Verified
Correct Answer:
Verified
Q18: Use integration to find the particular solution
Q19: What is the domain of the function
Q20: Write the following expression as a logarithm
Q21: Find the area of the region given
Q22: Use implicit differentiation to find <img src="https://d2lvgg3v3hfg70.cloudfront.net/TB8202/.jpg"
Q24: Find the indefinite integral <img src="https://d2lvgg3v3hfg70.cloudfront.net/TB8202/.jpg" alt="Find
Q25: Find the slope-intercept equation of the line
Q26: Suppose a population of bacteria is changing
Q27: Find <img src="https://d2lvgg3v3hfg70.cloudfront.net/TB8202/.jpg" alt="Find A)
Q28: Write the following expression as a logarithm