Multiple Choice
Solve the problem.
-The following graph shows the private, public and total national school enrollment for students for selectyears from 1970 through 2000. 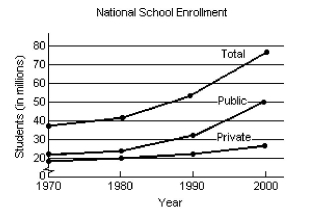 i) How is the graph for total school enrollment, T, determined from the graph of the private enrollment, r,the public enrollment, u?ii) During which 10-year period did the total number of students enrolled increase the least?iii) During which 10-year period did the total number of students enrolled increase the most?
A) i) T is the sum of r and u. ii) 1970 - 1980
Iii) 1990-2000
B) i) T is the sum of r and u. ii) 1990-2000
Iii) 1970-1980
C) i) T is the sum of r and u. ii) 1970 - 1980
Iii) 1980-1990
D) i) T is the difference of r and u. ii) 1970 - 1980
Iii) 1990-2000
Correct Answer:

Verified
Correct Answer:
Verified
Q102: Answer the question about the given function.<br>-Given
Q103: The graph of a function f is
Q104: Determine whether the relation represents a function.
Q105: Solve the problem.<br>-If an object weighs m
Q106: Answer the question about the given function.<br>-Given
Q107: For the given functions f and g,
Q109: Find the domain of the function.<br>-<img src="https://d2lvgg3v3hfg70.cloudfront.net/TB8253/.jpg"
Q110: The graph of a function f is
Q111: Solve the problem.<br>-The function F described by
Q112: The graph of a function f is