Multiple Choice
SCENARIO 2-1
An insurance company evaluates many numerical variables about a person before deciding on an appropriate rate for automobile insurance.A representative from a local insurance agency selected a random sample of insured drivers and recorded,X,the number of claims each made in the last 3 years,with the following results.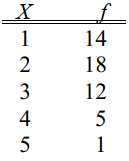
-A type of vertical bar chart in which the categories are plotted in the descending rank order of the magnitude of their frequencies is called a
A) contingency table.
B) Pareto chart.
C) stem-and-leaf display.
D) pie chart.
Correct Answer:

Verified
Correct Answer:
Verified
Q75: SCENARIO 2-8<br>The Stem-and-Leaf display represents the number
Q76: SCENARIO 2-18<br>The stem-and-leaf display below shows the
Q77: The Guidelines for Developing Visualizations recommend using
Q78: A_ is a summary table in which
Q79: You have collected information on the consumption
Q81: SCENARIO 2-3<br>Every spring semester,the School of Business
Q82: SCENARIO 2-14 <br>The table below contains the
Q83: SCENARIO 2-2<br>2-2 Organizing and Visualizing Variables<br>At a
Q84: SCENARIO 2-5<br>The following are the duration in
Q85: SCENARIO 2-14 <br>The table below contains the