Multiple Choice
SCENARIO 2-15 The figure below is the ogive for fat (in grams) for a sample of 36 pizza products where the upper boundaries of the intervals are: 5, 10, 15, 20, 25, and 30. 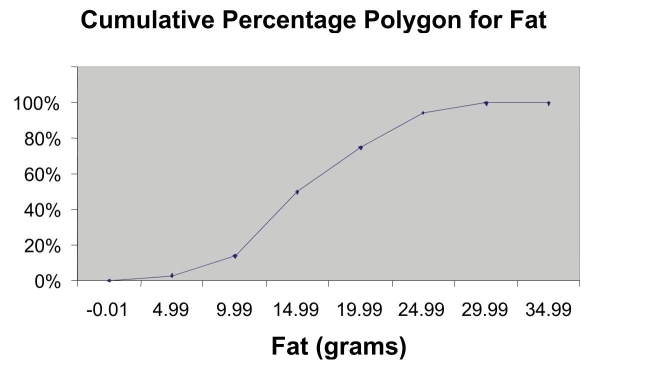
-Referring to Scenario 2-15, roughly what percentage of pizza products contains less than 10 grams of fat?
A) 3%
B) 14%
C) 50%
D) 75%
Correct Answer:

Verified
Correct Answer:
Verified
Q5: SCENARIO 2-5<br>The following are the duration in
Q21: SCENARIO 2-12<br>The table below contains the opinions
Q96: Given below is the scatter plot of
Q98: SCENARIO 2-15 The figure below is the
Q146: True or False: A multidimensional contingency table
Q156: True or False: The sum of relative
Q176: SCENARIO 2-8<br>The Stem-and-Leaf display represents the number
Q176: SCENARIO 2-12<br>The table below contains the opinions
Q179: True or False: Apple Computer, Inc.collected information
Q185: True or False: A polygon can be