True/False
Given below is the scatter plot of the price/earnings ratio versus earnings per share of 20 U.S.companies.There appears to be a negative relationship between price/earnings ratio and earnings per share. 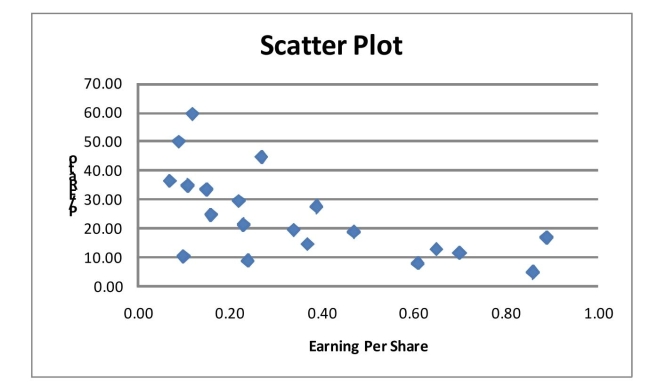
Correct Answer:

Verified
Correct Answer:
Verified
Related Questions
Q29: SCENARIO 2-6<br>A sample of 200 students at
Q74: SCENARIO 2-11<br>The ordered array below resulted from
Q84: SCENARIO 2-5<br>The following are the duration in
Q119: True or False: The Guidelines for Developing
Q149: Relationships in a contingency table can be
Q153: SCENARIO 2-12<br>The table below contains the opinions
Q169: SCENARIO 2-6<br>A sample of 200 students at
Q181: SCENARIO 2-12 The table below contains the
Q184: True or False: A good choice for
Q187: SCENARIO 2-12<br>The table below contains the opinions