True/False
Given below is the scatter plot of the market value (thousands$)and profit (thousands$)of 50 U.S.companies.There appears to be a negative relationship between market value and profit. 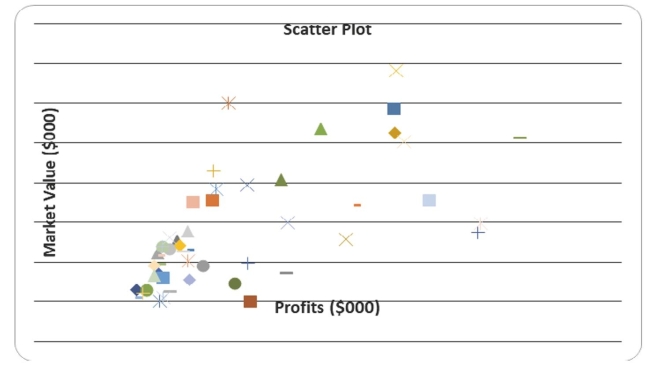
Correct Answer:

Verified
Correct Answer:
Verified
Q12: True or False: The percentage polygon is
Q24: SCENARIO 2-5<br>The following are the duration in
Q63: One of the developing countries is experiencing
Q85: SCENARIO 2-14 <br>The table below contains the
Q97: SCENARIO 2-8<br>The Stem-and-Leaf display represents the number
Q109: SCENARIO 2-17<br>The following table presents total retail
Q115: SCENARIO 2-14 <br>The table below contains the
Q122: SCENARIO 2-6<br>A sample of 200 students at
Q152: SCENARIO 2-10<br>The histogram below represents scores achieved
Q159: SCENARIO 2-11<br>The ordered array below resulted from