True/False
Given below is the scatter plot of the number of employees and the total revenue ($millions)of 20 U.S.companies.There appears to be a positive relationship between total revenue and the number of employees. 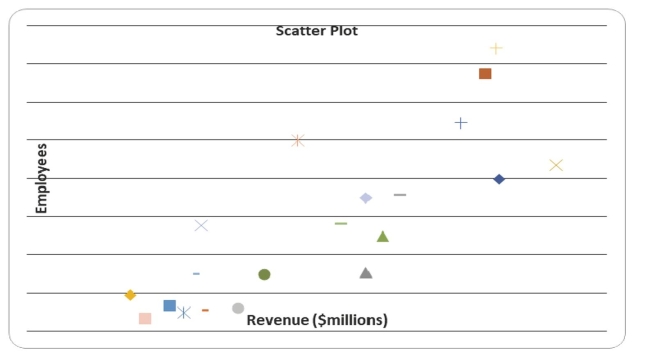
Correct Answer:

Verified
Correct Answer:
Verified
Q45: SCENARIO 2-14 <br>The table below contains the
Q56: SCENARIO 2-14 <br>The table below contains the
Q64: When polygons or histograms are constructed,which axis
Q81: SCENARIO 2-3<br>Every spring semester,the School of Business
Q107: SCENARIO 2-18<br>The stem-and-leaf display below shows the
Q129: The width of each class grouping or
Q143: SCENARIO 2-12<br>The table below contains the opinions
Q147: SCENARIO 2-14 <br>The table below contains the
Q173: SCENARIO 2-5<br>The following are the duration in
Q183: SCENARIO 2-9<br>The frequency distribution below represents the