Multiple Choice
SCENARIO 11-2 A realtor wants to compare the mean sales-to-appraisal ratios of residential properties sold in four neighborhoods (A, B, C, and D) .Four properties are randomly selected from each neighborhood and the ratios recorded for each, as shown below. 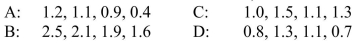 Interpret the results of the analysis summarized in the following table:
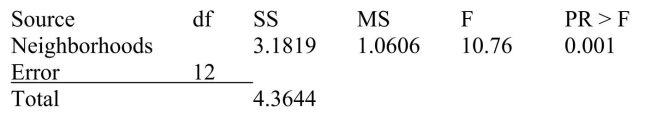
-Referring to Scenario 11-2, the null hypothesis for Levene's test for homogeneity of variances is
A) 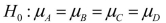
B) 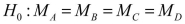
C) 
D) 
Correct Answer:

Verified
Correct Answer:
Verified
Q19: In a two-factor ANOVA analysis, the sum
Q20: SCENARIO 11-6 An agronomist wants to compare
Q23: SCENARIO 11-7 A student team in a
Q45: SCENARIO 11-4 <img src="https://d2lvgg3v3hfg70.cloudfront.net/TB2675/.jpg" alt="SCENARIO 11-4
Q73: SCENARIO 11-8<br>An important factor in selecting database
Q74: SCENARIO 11-7<br>A student team in a business
Q85: When would you use the Tukey-Kramer procedure?<br>A)To
Q120: SCENARIO 11-4<br>An agronomist wants to compare the
Q186: SCENARIO 11-8<br>An important factor in selecting database
Q196: SCENARIO 11-7<br>A student team in a business