Multiple Choice
SCENARIO 13-1 A large national bank charges local companies for using their services.A bank official reported the results of a regression analysis designed to predict the bank's charges (Y) -- measured in dollars per month -- for services rendered to local companies.One independent variable used to predict service charges to a company is the company's sales revenue (X) -- measured in millions of dollars.Data for 21 companies who use the bank's services were used to fit the model: 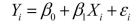 The results of the simple linear regression are provided below.
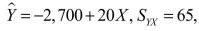
 two-tail p value =0.034 (for testing
-Referring to Scenario 13-1, a 95% confidence interval for  is (15, 30) .Interpret the interval.
A) You are 95% confident that the mean service charge will fall between $15 and $30 per month.
B) You are 95% confident that the sales revenue (X) will increase between $15 and $30 million for every $1 increase in service charge (Y) .
C) You are 95% confident that mean service charge (Y) will increase between $15 and $30 for every $1 million increase in sales revenue (X) .
D) At the  = 0.05 level, there is no evidence of a linear relationship between service charge (Y) and sales revenue (X) .
Correct Answer:

Verified
Correct Answer:
Verified
Q26: If the correlation coefficient (r)= 1.00,then<br>A)all the
Q45: True or False: The Regression Sum of
Q52: SCENARIO 13-3<br>The director of cooperative education at
Q54: SCENARIO 13-11<br>A computer software developer would like
Q79: If the Durbin-Watson statistic has a value
Q96: A zero population correlation coefficient between a
Q99: SCENARIO 13-7 An investment specialist claims that
Q102: In a simple linear regression the best
Q109: SCENARIO 13-4<br>The managers of a brokerage firm
Q168: SCENARIO 13-3<br>The director of cooperative education at