Multiple Choice
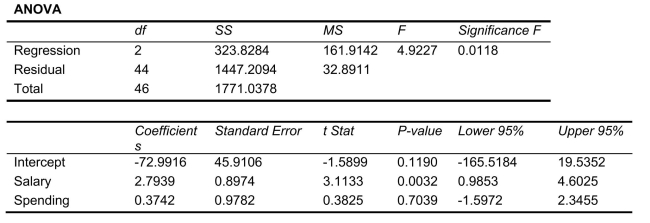
SCENARIO 14-15 The superintendent of a school district wanted to predict the percentage of students passing a sixth-grade proficiency test.She obtained the data on percentage of students passing the proficiency test (% Passing) , mean teacher salary in thousands of dollars (Salaries) , and instructional spending per pupil in thousands of dollars (Spending) of 47 schools in the state. Following is the multiple regression output with Y = % Passing as the dependent variable,  = Salaries and
  Spending:
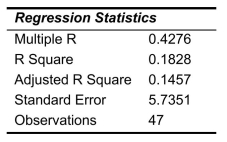
-Referring to Scenario 14-15, which of the following is a correct statement?
A) 14.57% of the total variation in the percentage of students passing the proficiency test can be explained by mean teacher salary and instructional spending per pupil.
B) 14.57% of the total variation in the percentage of students passing the proficiency test can be explained by mean teacher salary and instructional spending per pupil after
Adjusting for the number of predictors and sample size.
C) 14.57% of the total variation in the percentage of students passing the proficiency test can be explained by mean teacher salary holding constant the effect of instructional
Spending per pupil.
D) 14.57% of the total variation in the percentage of students passing the proficiency test can be explained by instructional spending per pupil holding constant the effect of
Mean teacher salary.
Correct Answer:

Verified
Correct Answer:
Verified
Q102: SCENARIO 14-15 <img src="https://d2lvgg3v3hfg70.cloudfront.net/TB2675/.jpg" alt="SCENARIO 14-15
Q128: SCENARIO 14-17<br>Given below are results from the
Q150: SCENARIO 14-13 An econometrician is interested in
Q151: An interaction term in a multiple regression
Q152: SCENARIO 14-15 The superintendent of a school
Q153: SCENARIO 14-18 A logistic regression model was
Q156: SCENARIO 14-18 A logistic regression model was
Q158: SCENARIO 14-18 A logistic regression model was
Q160: SCENARIO 14-8 A financial analyst wanted to
Q230: SCENARIO 14-15<br>The superintendent of a school district