Multiple Choice
SCENARIO 15-4 The superintendent of a school district wanted to predict the percentage of students passing a sixth-grade proficiency test.She obtained the data on percentage of students passing the proficiency test (% Passing) , daily mean of the percentage of students attending class (% Attendance) , mean teacher salary in dollars (Salaries) , and instructional spending per pupil in dollars (Spending) of 47 schools in the state. Let Y = % Passing as the dependent variable,  Attendance,
  Salaries and
  Spending. The coefficient of multiple determination (
  ) of each of the 3 predictors with all the other remaining predictors are, respectively, 0.0338, 0.4669, and 0.4743. The output from the best-subset regressions is given below:
 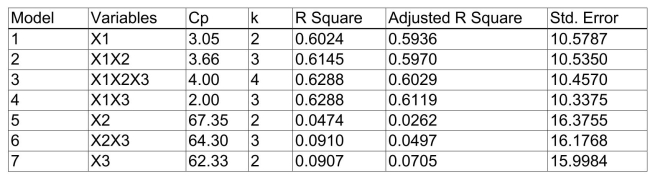 Following is the residual plot for % Attendance:
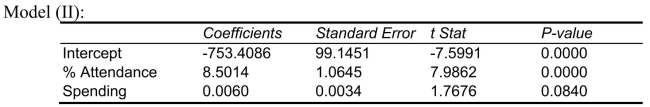
 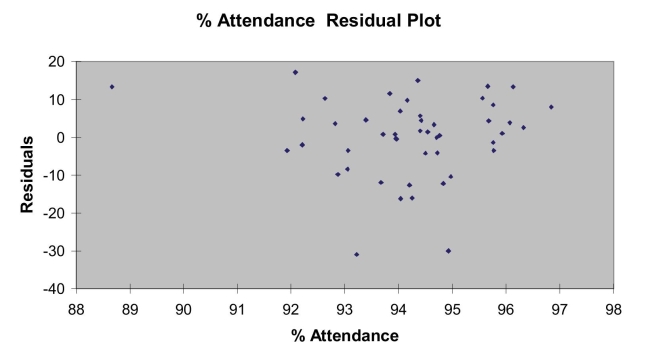 Following is the output of several multiple regression models:
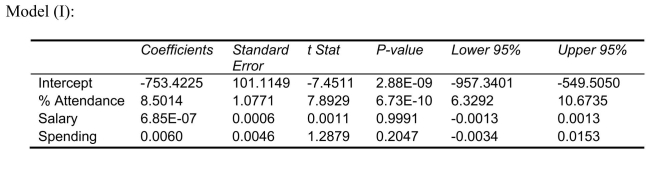
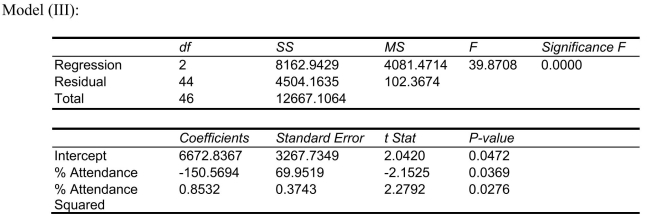
-Referring to Scenario 15-4, the better model using a 5% level of significance derived from the "best" model above is
A) 
B) 
C) 
D) 
Correct Answer:

Verified
Correct Answer:
Verified
Q9: SCENARIO 15-4 <img src="https://d2lvgg3v3hfg70.cloudfront.net/TB2675/.jpg" alt="SCENARIO 15-4
Q20: True or False: The parameter estimates are
Q25: True or False: Collinearity is present when
Q31: SCENARIO 15-6 Given below are results from
Q33: SCENARIO 15-1 A certain type of rare
Q34: SCENARIO 15-6 Given below are results from
Q35: SCENARIO 15-6 Given below are results from
Q37: SCENARIO 15-4 The superintendent of a school
Q39: SCENARIO 15-6 Given below are results from
Q41: SCENARIO 15-6 Given below are results from