True/False
SCENARIO 18-3 A financial analyst wanted to examine the relationship between salary (in $1,000)and 4 variables: age (  = Age), experience in the field (
  = Exper), number of degrees (
  = Degrees), and number of previous jobs in the field (
  = Prevjobs).He took a sample of 20 employees and obtained the following Microsoft Excel output: SUMMARY OUTPUT
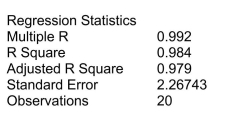
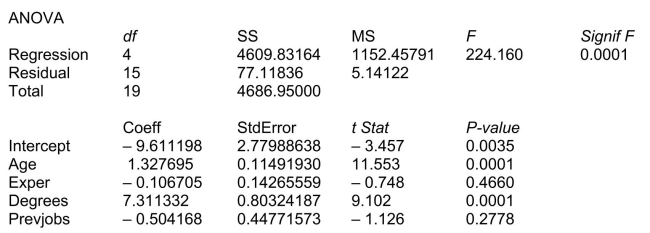
-Referring to Scenario 18-3, the analyst wants to use a t test to test for the significance of the coefficient of  .At a level of significance of 0.01, the department head would decide that
  .
.
Correct Answer:

Verified
Correct Answer:
Verified
Q31: SCENARIO 18-8<br>The superintendent of a school district
Q48: SCENARIO 18-5<br>You worked as an intern at
Q62: SCENARIO 18-10 Given below are results from
Q64: SCENARIO 18-9 What are the factors that
Q75: A political pollster randomly selects a sample
Q93: SCENARIO 18-8<br>The superintendent of a school district
Q128: A Paso Robles wine producer wanted to
Q211: SCENARIO 18-12<br>The marketing manager for a nationally
Q255: Suppose the probability of producing a defective
Q260: A Paso Robles wine producer wanted to