Multiple Choice
SCENARIO 18-8 The superintendent of a school district wanted to predict the percentage of students passing a sixth-grade proficiency test.She obtained the data on percentage of students passing the proficiency test (% Passing) , daily mean of the percentage of students attending class (% Attendance) , mean teacher salary in dollars (Salaries) , and instructional spending per pupil in dollars (Spending) of 47 schools in the state. Following is the multiple regression output with  as the dependent variable,
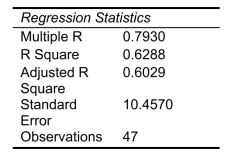
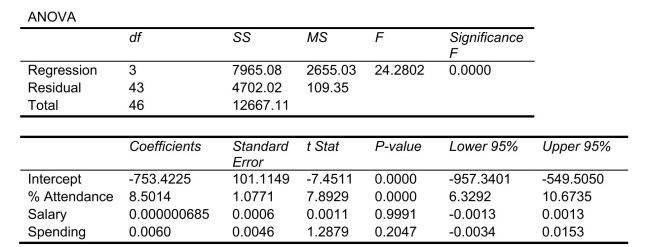
-Referring to Scenario 18-8, which of the following is a correct statement?
A) 60.29% of the total variation in the percentage of students passing the proficiency test can be explained by daily mean of the percentage of students attending class, mean
Teacher salary, and instructional spending per pupil.
B) 60.29% of the total variation in the percentage of students passing the proficiency test can be explained by daily mean of the percentage of students attending class, mean
Teacher salary, and instructional spending per pupil after adjusting for the number of
Predictors and sample size.
C) 60.29% of the total variation in the percentage of students passing the proficiency test can be explained by daily mean of the percentage of students attending class holding
Constant the effect of mean teacher salary, and instructional spending per pupil.
D) 60.29% of the total variation in the percentage of students passing the proficiency test can be explained by daily mean of the percentage of students attending class after
Adjusting for the effect of mean teacher salary, and instructional spending per pupil.
Correct Answer:

Verified
Correct Answer:
Verified
Q139: SCENARIO 18-9<br>What are the factors that determine
Q182: SCENARIO 18-12<br>The marketing manager for a nationally
Q199: An Undergraduate Study Committee of 6 members
Q214: SCENARIO 18-5<br>You worked as an intern at
Q235: SCENARIO 18-10 Given below are results from
Q237: SCENARIO 18-2 One of the most common
Q238: SCENARIO 18-11 A logistic regression model was
Q242: SCENARIO 18-11 A logistic regression model was
Q243: SCENARIO 18-8 The superintendent of a school
Q244: SCENARIO 18-10 Given below are results from