Multiple Choice
Look at the utility function graphed below and select the type of decision-maker that corresponds to the graph.
A) Risk averter
B) Risk neutral
C) Risk taker
D) Risk player 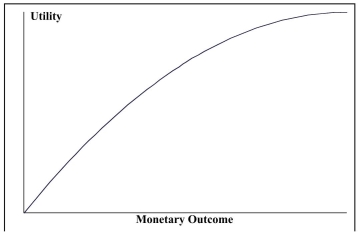
Correct Answer:

Verified
Correct Answer:
Verified
Q2: In a local cellular phone area,company A
Q3: SCENARIO 20-1<br>The following payoff table shows profits
Q4: SCENARIO 20-1<br>The following payoff table shows profits
Q43: SCENARIO 20-2<br>The following payoff matrix is given
Q44: SCENARIO 20-6<br>A student wanted to find out
Q65: SCENARIO 20-5 <img src="https://d2lvgg3v3hfg70.cloudfront.net/TB2675/.jpg" alt="SCENARIO 20-5
Q79: The difference between expected payoff under certainty
Q81: Blossom's Flowers purchases roses for sale for
Q99: At Eastern University,60% of the students are
Q116: SCENARIO 20-1<br>The following payoff table shows profits