Essay
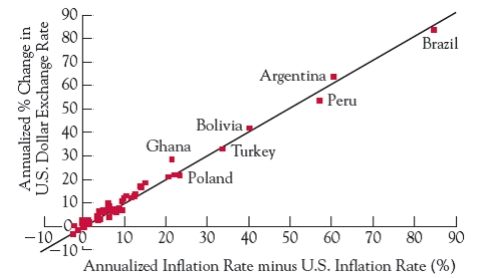
Figure 10.4, shown below, presented data on 62 countries' inflation rates relative to the U.S. rate of inflation and the percent change in the exchange rate for the years 1980-2010. What was the relationship between these two variables?
Correct Answer:

Verified
The data shows that countries with high ...View Answer
Unlock this answer now
Get Access to more Verified Answers free of charge
Correct Answer:
Verified
View Answer
Unlock this answer now
Get Access to more Verified Answers free of charge
Q19: Depreciation of the real exchange rate:<br>A) makes
Q20: The law of one price:<br>A) is based
Q21: Large, advanced economies like the United States,
Q22: Between 1998 and the end of 2000,
Q23: A country's current account represents:<br>A) the amount
Q25: If in late 2016 100 U.S. dollars
Q26: A country that has a capital account
Q27: When a currency is described as undervalued,
Q28: If Americans develop a greater appreciation for
Q29: A U.S. resident who wants to purchase