Multiple Choice
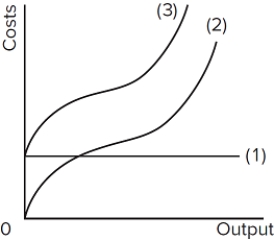 In the diagram, curves 1, 2, and 3 represent
A) average fixed cost, average variable cost, and average total cost respectively.
B) total variable cost, total fixed cost, and total cost respectively.
C) total fixed cost, total variable cost, and total cost respectively.
D) marginal product, average variable cost, and average total cost respectively.
Correct Answer:

Verified
Correct Answer:
Verified
Q203: Implicit and explicit costs are different in
Q204: If marginal cost exceeds average total cost
Q205: If a firm doubles its resource inputs
Q206: <img src="https://d2lvgg3v3hfg70.cloudfront.net/TB8602/.jpg" alt=" Refer to the
Q207: An explicit cost is<br>A)omitted when accounting profits
Q209: If start-up firms can quickly shift the
Q210: Answer the question on the basis of
Q211: In the long run, a firm will
Q212: The long run is a period of
Q213: The sole proprietor of the Milwaukee Machine