Multiple Choice
 Refer to the graph. A decrease in fixed costs is shown by
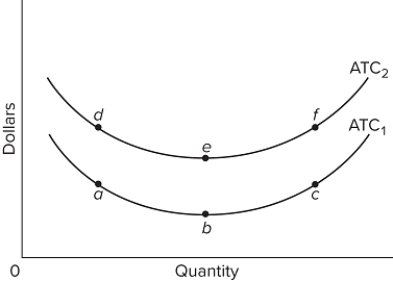
A) a move along short-run average total cost curve ATC₂ from point e to point f.
B) a move along short-run average total cost curve ATC₁ from point a to point b.
C) the shift of the short-run average total cost curve from ATC₁ to ATC₂.
D) the shift of the short-run average total cost curve from ATC₂ to ATC₁.
Correct Answer:

Verified
Correct Answer:
Verified
Q334: Answer the question on the basis of
Q335: Accounting profits equal total revenue minus<br>A)total explicit
Q336: What is the difference between the short
Q337: Which of the following types of firms
Q338: Answer the question on the basis of
Q340: If you operated a small bakery, which
Q341: <img src="https://d2lvgg3v3hfg70.cloudfront.net/TB8602/.jpg" alt=" Refer to the
Q342: The question is based on the following
Q343: <img src="https://d2lvgg3v3hfg70.cloudfront.net/TB8602/.jpg" alt=" In the diagram,
Q344: If a firm increases all of its