Multiple Choice
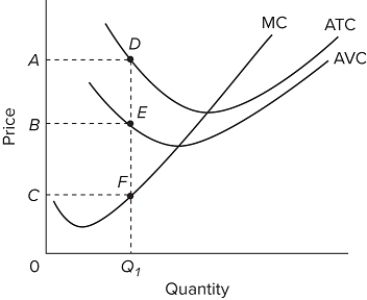 Refer to the provided graph. If the firm is producing at Q ₁, the area 0 BEQ ₁ represents
A) total costs.
B) total variable costs.
C) total fixed costs.
D) average variable costs.
Correct Answer:

Verified
Correct Answer:
Verified
Related Questions
Q213: The sole proprietor of the Milwaukee Machine
Q214: The main difference between the short run
Q215: The total output of a firm will
Q216: What is the relationship between marginal cost
Q217: The following is cost information for the
Q219: The ABC Corporation decreases all of its
Q220: Which of the following is an example
Q221: At what point does marginal product equal
Q222: Why is it important to distinguish between
Q223: <img src="https://d2lvgg3v3hfg70.cloudfront.net/TB8602/.jpg" alt=" Based on the