Multiple Choice
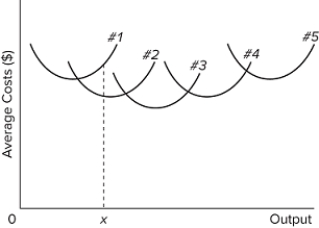 The diagram shows the short-run average total cost curves for five different plant sizes of a firm. The shape of each individual curve reflects
A) increasing returns, followed by diminishing returns.
B) economies of scale, followed by diseconomies of scale.
C) constant costs.
D) increasing costs, followed by decreasing costs.
Correct Answer:

Verified
Correct Answer:
Verified
Q348: The following statements about the "sunk cost
Q349: At an output of 1,000 units per
Q350: What do wages paid to factory workers,
Q351: The phrase "don't cry over spilt milk"
Q352: Which of the following statements is correct?<br>A)Average
Q354: Answer the question on the basis of
Q355: <img src="https://d2lvgg3v3hfg70.cloudfront.net/TB8602/.jpg" alt=" Refer to the
Q356: If the short-run average variable costs of
Q357: <img src="https://d2lvgg3v3hfg70.cloudfront.net/TB8602/.jpg" alt=" The bigger
Q358: <img src="https://d2lvgg3v3hfg70.cloudfront.net/TB8602/.jpg" alt=" Refer to the