Multiple Choice
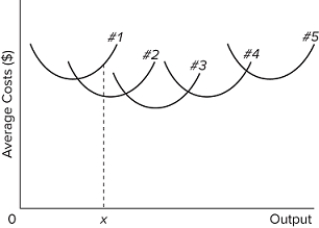 The diagram shows the short-run average total cost curves for five different plant sizes of a firm. The position of these five curves in relation to one another reflects
A) economies and diseconomies of scale.
B) the effect of fixed costs on ATC as output increases.
C) the law of constant costs.
D) the law of diminishing returns.
Correct Answer:

Verified
Correct Answer:
Verified
Q132: Answer the question on the basis of
Q133: Suppose that, when producing 50 units of
Q134: If average variable cost is $74 and
Q135: Marginal cost can be defined as the<br>A)change
Q136: The following is cost information for the
Q138: Why does the short-run marginal-cost curve eventually
Q139: Marginal cost is the<br>A)rate of change in
Q140: If the price of a variable resource
Q141: If long-run average total cost decreases as
Q142: The following is cost information for the