Multiple Choice
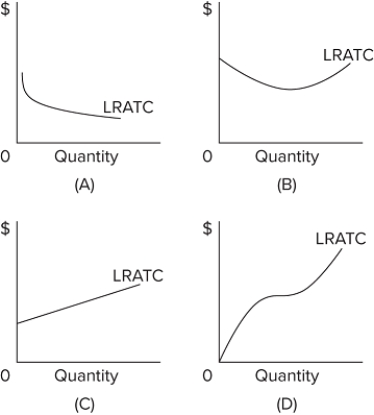 Refer to the provided graphs. They show the long-run average total cost (LRATC) for a product. Which graph would most probably be applicable to a natural monopoly?
A) graph A
B) graph B
C) graph C
D) graph D
Correct Answer:

Verified
Correct Answer:
Verified
Q221: At what point does marginal product equal
Q222: Why is it important to distinguish between
Q223: <img src="https://d2lvgg3v3hfg70.cloudfront.net/TB8602/.jpg" alt=" Based on the
Q224: Normal profits are<br>A)the profits reported by accountants
Q225: <img src="https://d2lvgg3v3hfg70.cloudfront.net/TB8602/.jpg" alt=" Refer to the
Q227: Answer the question on the basis of
Q228: The following table shows the short-run total
Q229: Normal profit is an implicit cost.
Q230: Harvey quit his job at State University,
Q231: Normal profit is<br>A)determined by subtracting implicit costs