Multiple Choice

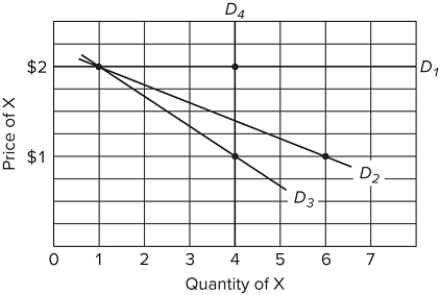 Refer to the table and graph. Suppose that the price of X falls from $2 to $1, while the price of Y remains at $4. Which of the following represents the demand curve for X if the consumer has money income of $10 to spend on X and Y?
A) D₁
B) D₂
C) D₃
D) D₄
Correct Answer:

Verified
Correct Answer:
Verified
Q136: Most economists contend that<br>A)noncash gifts are more
Q137: If MU a/ Pₐ = 100/$35 =
Q138: <img src="https://d2lvgg3v3hfg70.cloudfront.net/TB8602/.jpg" alt=" Refer to the
Q139: Can marginal utility be negative? Briefly explain.
Q140: If the price of product X rises,
Q142: A graph that shows the maximum combinations
Q143: Frank is purchasing products C and D
Q144: If the total utility from consuming five
Q145: Most people do not steal, because<br>A)stolen goods
Q146: In spending all his income on beer