Multiple Choice
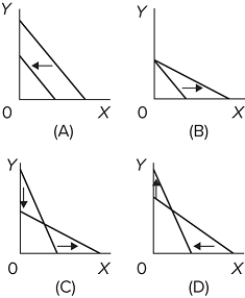 Which of the graphs shows a change in the buyer's income, but no changes in the prices of X and Y?
A) graph A
B) graph B
C) graph C
D) graph D
Correct Answer:

Verified
Correct Answer:
Verified
Related Questions
Q201: Suppose that football tickets at your university
Q202: "Essential" water is cheaper than "nonessential" diamonds
Q203: A change in the relative prices for
Q204: <img src="https://d2lvgg3v3hfg70.cloudfront.net/TB8602/.jpg" alt=" Given the indifference
Q205: The diamond-water paradox arises because<br>A)essential goods may
Q207: It is possible for a consumer's indifference
Q208: The law of diminishing marginal utility implies
Q209: In moving northeasterly from the origin, we
Q210: The consumer demand curve for a product
Q211: Understanding the water and diamond paradox is