Multiple Choice
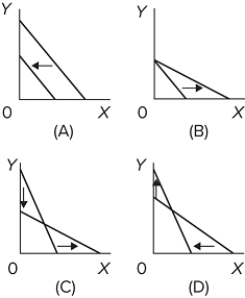 Which of the graphs shows a decrease in the price of X and an increase in the price of Y, but no change in the buyer's budget?
A) graph A
B) graph B
C) graph C
D) graph D
Correct Answer:

Verified
Correct Answer:
Verified
Q341: Suppose that a consumer who spends her
Q342: <img src="https://d2lvgg3v3hfg70.cloudfront.net/TB8602/.jpg" alt=" Refer to the
Q343: List the four assumptions about consumers that
Q344: The marginal rate of substitution<br>A)may increase or
Q345: A consumer currently spends a given budget
Q347: Assume that a consumer purchases a combination
Q348: <img src="https://d2lvgg3v3hfg70.cloudfront.net/TB8602/.jpg" alt=" In the diagram,
Q349: Where total utility is at a maximum,
Q350: Edith is buying products X and Y
Q351: <img src="https://d2lvgg3v3hfg70.cloudfront.net/TB8602/.jpg" alt=" Given the indifference