Multiple Choice
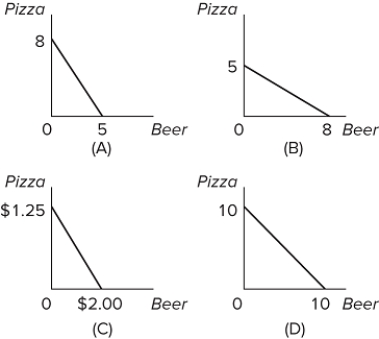 Refer to the graphs. Pizza and beer are the only two goods Jon consumes. The price of beer is $2.00 per pitcher and pizza is $1.25 per slice. If Jon has only $10 to spend for the evening, which graph represents the set of possible combinations of beer and pizza that he can buy?
A) graph A
B) graph B
C) graph C
D) graph D
Correct Answer:

Verified
Correct Answer:
Verified
Q191: An increase in the real income of
Q192: A rational consumer will try to achieve
Q193: After eating four slices of pizza, you
Q194: <img src="https://d2lvgg3v3hfg70.cloudfront.net/TB8602/.jpg" alt=" If the prices
Q195: Marginal utility is total utility divided by
Q197: Answer the question based on the table
Q198: Each point on a single indifference curve
Q199: Give a brief description of the law
Q200: The table shows the utility schedule for
Q201: Suppose that football tickets at your university