Multiple Choice
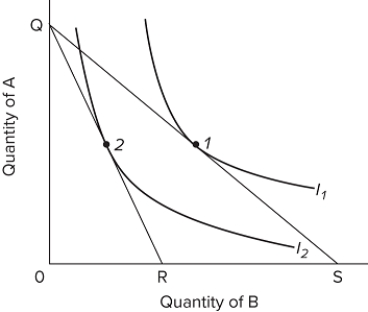 The graph shows two indifference curves, and QR and QS represent different budget lines. A change in the equilibrium position on the diagram from point 1 to point 2 could result, other things being equal, from
A) an increase in the price of B.
B) a decrease in the price of A.
C) a decrease in the consumer's money income.
D) an equal percentage increase in the consumer's money income and in the price of B.
Correct Answer:

Verified
Correct Answer:
Verified
Q74: Suppose you have a limited money income
Q75: Suppose that MU x/ Pₓ exceeds MU
Q76: The satisfaction or pleasure one gets from
Q77: Marginal utility can be<br>A)positive, but not negative.<br>B)positive
Q78: Answer the question on the basis of
Q80: Why is it not sufficient to just
Q81: The table shows the total utility data
Q82: If consumers are convinced by ads that
Q83: To derive the demand curve of a
Q84: When DVD players start becoming obsolete then,