Multiple Choice
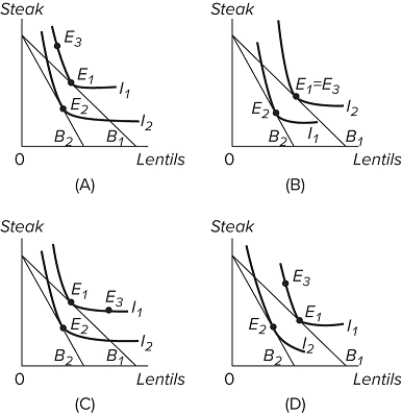 Recently, the price of lentils increased. As a result Lincoln residents noticed that their neighbor, Rasputin, decreased his consumption of lentils and of steak. Rasputin said his utility had declined. Many citizens made donations to the "Rasputin Relief Fund." Rasputin was given a cash grant equal to the amount he claimed to need to regain his initial utility level. Happy and thankful, Rasputin rushed off to the store to make his new purchases-consisting of more steak and slightly less lentils. Each graph above shows two indifference curves for Rasputin, I₁ and I₂, and the two budget constraints, B₁ and B₂, that he faced. Let E₁ represent Rasputin's initial equilibrium, E₂ equal his equilibrium following the increase in the price of lentils, and E₃ his equilibrium after receiving the cash from the relief fund. Which graph above is consistent with Rasputin's claims in the above story?
A) graph A
B) graph B
C) graph C
D) graph D
Correct Answer:

Verified
Correct Answer:
Verified
Q286: <img src="https://d2lvgg3v3hfg70.cloudfront.net/TB8602/.jpg" alt=" Refer to the
Q287: Which of the following is correct?<br>A)Budget lines
Q288: The ratio of the prices of two
Q289: A consumer is maximizing her utility with
Q290: If two combinations of goods X and
Q292: According to economists, gift registries, returning gifts
Q293: The table shows the marginal-utility schedules for
Q294: The table below shows the utility schedule
Q295: <img src="https://d2lvgg3v3hfg70.cloudfront.net/TB8602/.jpg" alt=" If the budget
Q296: Assume that Tonya consumes only two products,