Multiple Choice
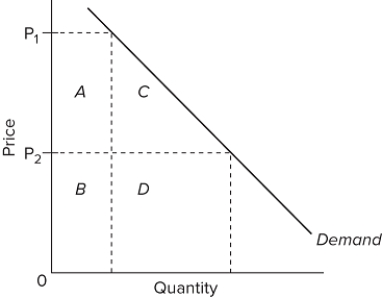 Refer to the diagram. Total revenue at price P₁ is indicated by area(s)
A) C + D.
B) A + B.
C) A + C.
D) A.
Correct Answer:

Verified
Correct Answer:
Verified
Related Questions
Q54: Along a linear downward-sloping demand curve, the
Q55: In the price range where demand is
Q56: A 10 percent increase in the price
Q57: A firm can sell as much as
Q58: An increase in the price of tickets
Q60: A price increase from $43 to $49
Q61: <img src="https://d2lvgg3v3hfg70.cloudfront.net/TB8602/.jpg" alt=" Suppose the total-revenue
Q62: Supply curves for antiques tend to be
Q63: A union argues that a price cut
Q64: A 4 percent reduction in the price