Multiple Choice
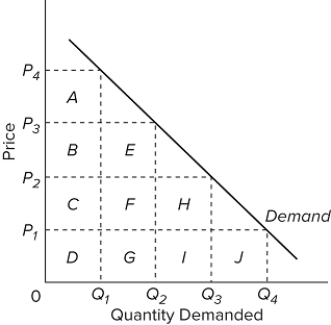 Refer to the above graph. If the price is P₃, then the total revenue is represented by area
A) B + C + D.
B) E + F + G.
C) B + C + D + E + F + G.
D) A + B + C + D + E + F + G.
Correct Answer:

Verified
Correct Answer:
Verified
Related Questions
Q222: The more time consumers have to adjust
Q223: Blossom, Inc., sells 900 bottles of perfume
Q224: The total revenue received by sellers of
Q225: We would expect the income elasticity of
Q226: In markets entered by Southwest Airlines, gains
Q228: An antidrug policy that reduces the supply
Q229: Given that the demand for grains is
Q230: <img src="https://d2lvgg3v3hfg70.cloudfront.net/TB8602/.jpg" alt=" The diagram suggests
Q231: It is argued that, with a rising
Q232: When the percentage change in price is