Multiple Choice
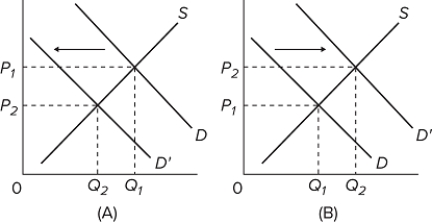
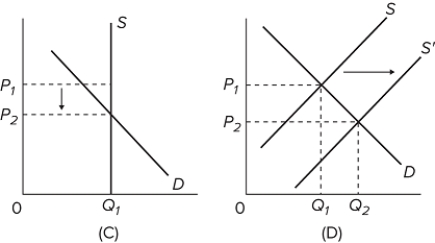 Refer to the above graphs. Which graph depicts a situation where sellers are increasing their output because their product is becoming more popular among buyers?
A) graph A
B) graph B
C) graph C
D) graph D
Correct Answer:

Verified
Correct Answer:
Verified
Related Questions
Q244: A supply curve that is a vertical
Q245: Explain how the price elasticity of supply
Q246: The total revenue received by sellers of
Q247: Compared to coffee, we would expect the
Q248: A normal good would have a positive
Q250: How do you interpret the coefficient of
Q251: If sellers could price-discriminate and charge two
Q252: A firm produces and sells two goods,
Q253: A perfectly inelastic demand curve<br>A)has a price
Q254: Suppose the income elasticity of demand for