Multiple Choice
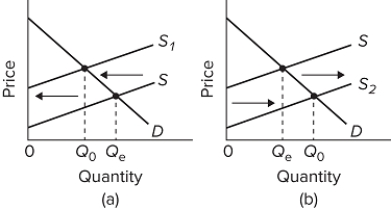 Refer to the diagrams for two separate product markets. Assume that society's optimal level of output in each market is Q₀ and that government purposely shifts the market supply curve from S to S₁ in diagram (a) on the left and from S to S₂ in diagram (b) on the right. We can conclude that the government is correcting for
A) negative externalities in diagram (a) and positive externalities in diagram (b) .
B) positive externalities in diagram (a) and negative externalities in diagram (b) .
C) negative externalities in both diagrams.
D) positive externalities in both diagrams.
Correct Answer:

Verified
Correct Answer:
Verified
Q2: The franchising of fast-food restaurants would be
Q40: When the government bails out failing banks,
Q135: When you enter a congested roadway,<br>A)you are
Q136: Allocative efficiency occurs where the collective sum
Q137: <img src="https://d2lvgg3v3hfg70.cloudfront.net/TB8602/.jpg" alt=" Refer to the
Q138: Where there are spillover (or external)benefits from
Q140: <img src="https://d2lvgg3v3hfg70.cloudfront.net/TB8602/.jpg" alt=" Refer to the
Q142: Suppose that the Anytown city government asks
Q143: A positive externality or spillover benefit occurs
Q144: By requiring car producers to install emission