Multiple Choice
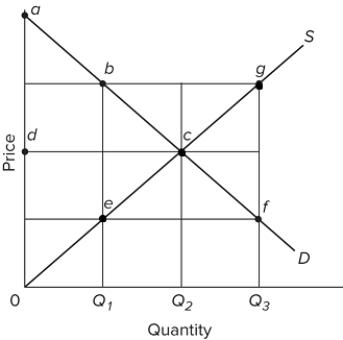 Refer to the provided graph of a competitive market. If the output level increases from Q₂ to Q₃, then the
A) marginal cost of the product becomes closer to its marginal benefit.
B) marginal cost of the product increases, while its marginal benefit decreases.
C) marginal cost of the product decreases, while its marginal benefit increases.
D) marginal cost of the product stays constant, while its marginal benefit increases.
Correct Answer:

Verified
Correct Answer:
Verified
Q45: <img src="https://d2lvgg3v3hfg70.cloudfront.net/TB8602/.jpg" alt=" Refer to the
Q48: <img src="https://d2lvgg3v3hfg70.cloudfront.net/TB8602/.jpg" alt=" Refer to the
Q51: <img src="https://d2lvgg3v3hfg70.cloudfront.net/TB8602/.jpg" alt=" Refer to the
Q54: If the demand curve reflects consumers' full
Q76: If Congress decreases the amount of government
Q98: Which of the following would be an
Q122: The moral hazard problem is the tendency
Q135: There is an adverse selection problem in
Q155: In a situation where an externality occurs,
Q201: In a free-market economy, a product which