Multiple Choice
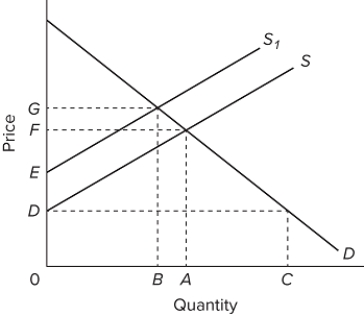 Refer to the provided supply and demand graph for a product. In the graph, line S is the current supply of this product, while line S1 is the optimal supply from the society's perspective. This figure suggests that there is (are)
A) external benefits from the production of this product.
B) external costs in the production of this product.
C) currently an underallocation of resources toward producing this product.
D) positive externalities from producing the product.
Correct Answer:

Verified
Correct Answer:
Verified
Q1: Producer surplus is the difference between<br>A) the
Q14: The marginal cost to society of reducing
Q41: Assume that there are four consumers A,
Q46: An effective antipollution policy from the economic
Q166: Product reviews help to alleviate problems associated
Q168: <img src="https://d2lvgg3v3hfg70.cloudfront.net/TB8602/.jpg" alt=" Refer to the
Q169: Oftentimes, the socially optimal quantity for a
Q170: Amanda buys a ruby for $240 for
Q171: <img src="https://d2lvgg3v3hfg70.cloudfront.net/TB8602/.jpg" alt=" Refer to the
Q175: In response to the 2008 financial crisis,