Multiple Choice
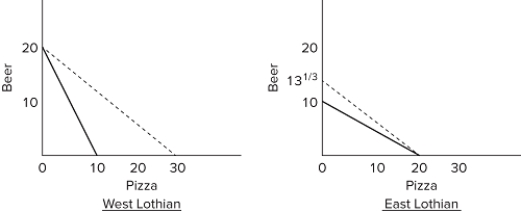 In the accompanying diagrams, solid lines are production possibilities curves, and the dashed lines are trading possibilities curves. The data contained in the production possibilities curves are based on the assumption of
A) imperfect substitutability of resources between beer and pizza production.
B) constant costs.
C) decreasing costs.
D) increasing costs.
Correct Answer:

Verified
Correct Answer:
Verified
Q35: Export subsidies are designed to aid domestic
Q111: Dumping is the sale of a product
Q166: Whenever a foreign producer is selling a
Q196: With constant costs in production, specialization tends
Q235: <img src="https://d2lvgg3v3hfg70.cloudfront.net/TB8602/.jpg" alt=" The data in
Q236: <img src="https://d2lvgg3v3hfg70.cloudfront.net/TB8602/.jpg" alt=" The accompanying table
Q238: <img src="https://d2lvgg3v3hfg70.cloudfront.net/TB8602/.jpg" alt=" Refer to the
Q239: <img src="https://d2lvgg3v3hfg70.cloudfront.net/TB8602/.jpg" alt=" Refer to the
Q241: A protective tariff will<br>A)increase the sales of
Q243: <img src="https://d2lvgg3v3hfg70.cloudfront.net/TB8602/.jpg" alt=" Refer to the